Tips for Successfully Deploying Wave Analytics

As much as I love Wave Analytics, it is not very fun to deploy from Sandbox (at this time).  There are many different things to keep in mind when moving Wave from one environment to another (even if it is just Sandbox to Sandbox).  Knowing these shortcomings ahead of your pending deployment will save you a big headache, as you can plan accordingly.  There is a good bit to discuss, so let’s jump right in!

Salesforce-Analytics-Cloud-cropped

Apps

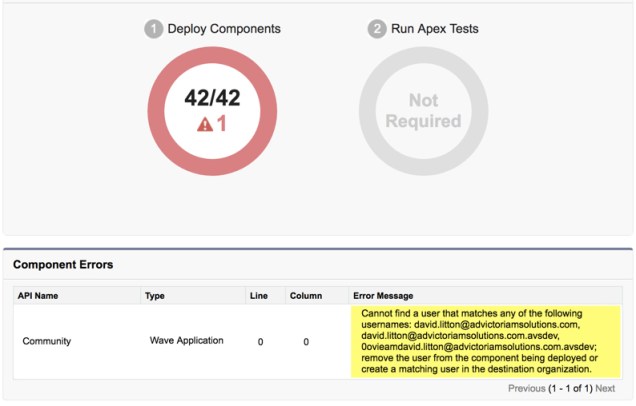
These are nice and easy to deploy, but you have to be careful of the username naming convention you’re using, if you have any specific sharing to Users on your App.  This can be a problem if you’re a consultant and you’re setup in a Sandbox separately from the Production environment, and possibly the naming convention for your Username was switched up.  Or, it could be from you assigning the App to a specific Community User and that Community User was only created in your Source Org and not your Target Org.  Either scenario will cause an error.

WaveError.jpg

Dataflow

This is something that you need to be careful with.  The Dataflow that you build in your Source Org will overwrite the existing Dataflow in your Target Org.  This means, if you have anything in your Dataflow (if it already exists) in the Target Org, you need to make sure you still have it in the Source Org’s Dataflow, or it will be deleted.

The key with Dataflows is to immediately run them to get all of your Datasets populated as quickly as possible.  Make sure you’ve got all the fields in your Target Org that the Dataflow references, and that the Analytics Cloud Integration User has FLS.  You can deploy a Dataflow without meeting those requirements, and it will error when you run it if you forget.
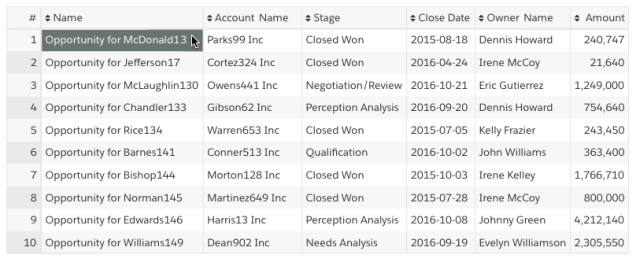
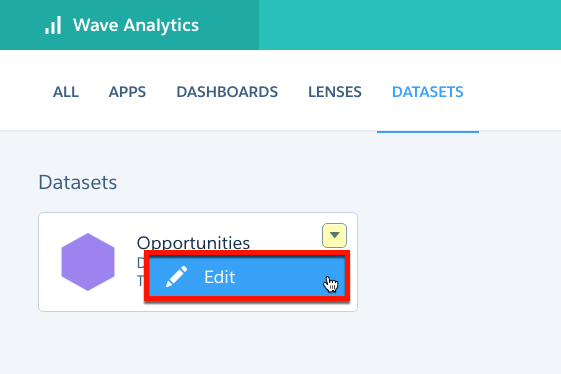
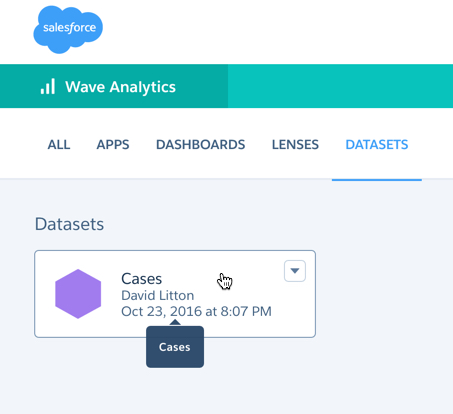
Datasets

I’m going to go out and just say that you shouldn’t deploy any of your Datasets.  Let your Dataflow create them upon running the first time.  You run the risk of having the Dataset Name adjusted if you do anything out of sequence.  And, this can cause additional issues when you’re deploying complex Dashboards (as I’ll touch on in more detail shortly).
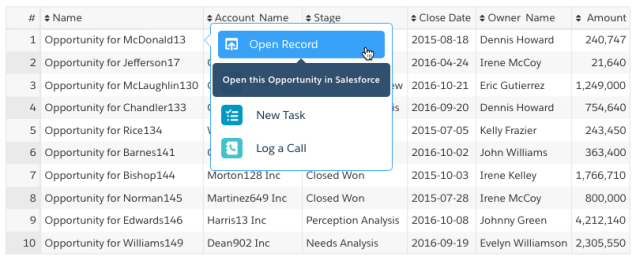
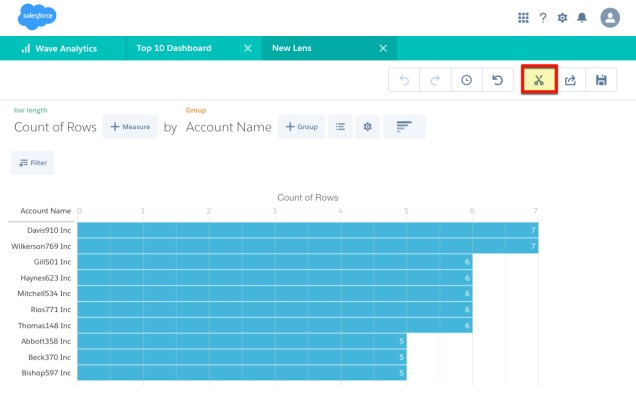
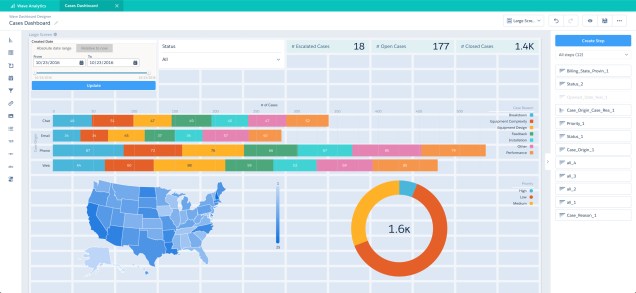
Dashboards & Lenses

Dashboards and Lenses are annoyingly close to complete.  These will show you an error when you first open them, because the datasets they’re targeting are empty.

Dashboard Error.jpg

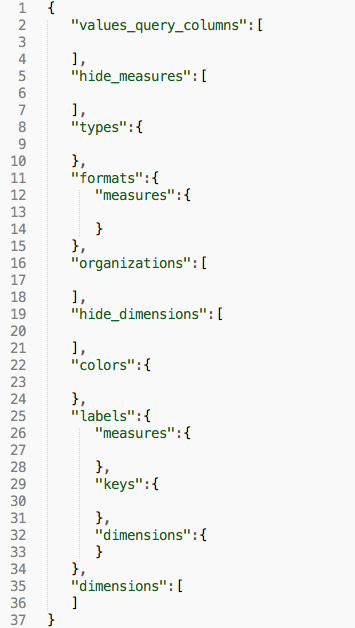
What you have to do is make sure your Dataflow has successfully populated the new Datasets, and then go into the JSON of your Dashboard or Lens and make the adjustments.  Note on the above error, it will make you press Continue for every Dataset in your Dashboard… so don’t think it’s broke if you have 10 Datasets, you just have to click 10 times.

The first one, you’ve heard it a million times… don’t hard-code IDs in Salesforce!!  Well, in Wave, you’ve got no other choice.  When you deploy a new Dataset, your Target Org will have a new Dataset ID.  Your Dashboards and Lenses are going to be still referencing the older Dataset ID, and you need to go in and do a “Find and Replace” for the Dataset ID.  This can be pretty easy if you’ve got a simple Dashboard with one dataset, but once you get into double-digit, you run into potentially some of the other areas of trouble…

The Dataset Name also is used inside the Connector aka dataSourceLinks (how you link Datasets together so they dynamically filter) and in any PIGQL.  So, if you deployed a Dataset incorrectly and the name changes, you’re going to have to also update the Name in these spots similar to how you did with the ID.

Recipes

Recipes became GA in Spring ’17.  There extremely powerful and are getting even stronger with the Summer ’17 release.  In the Summer ’17 release they’re becoming accessible through the REST API.  What they allow you to do is to filter and transform an existing dataset extremely easily.  You can do joins to other datasets, bucketing of fields, adding of filters, and more.  The issue here is, they don’t live anywhere in the metadata (at this time).  So, whatever you create in a recipe, you’re going to have to manually re-create in your Target Org.  At the rate they’re improving all aspects of Wave, I am hopeful this becomes deployable with the Winter ’18 release.
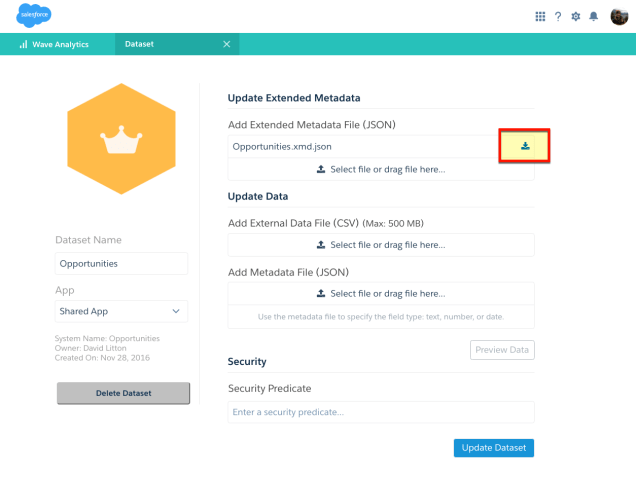
Security Predicates

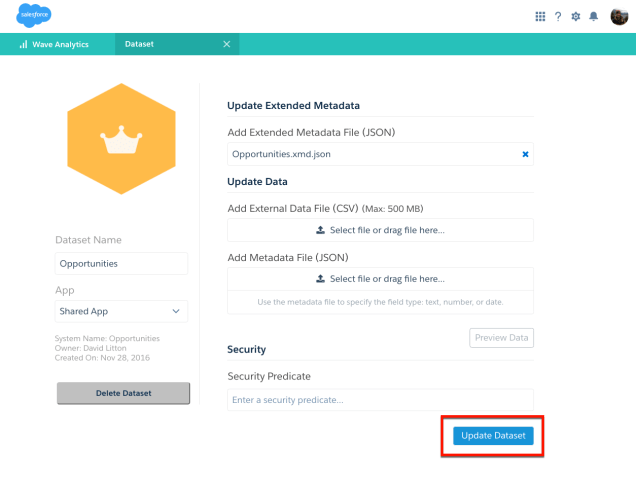
Unfortunately, Security Predicates don’t live anywhere (at this time) to where you can successfully deploy them.  Luckily these are typically straightforward, meaning that it’s typically a quick copy & paste to get your Security Predicate moved into the new environment.  When you’re adding a Security Predicate into your new environment, you need to make sure you meet these basic requirements:

  1. Analytics Security User has READ Access to all referenced Fields
  2. The Running User (you) has READ Access to all referenced Fields

In short, make sure you correctly deployed the FLS for the Fields that you had in your previous environment, or you’ll be running around in circles.

RECAP

Sometimes I wonder why I bother to deploy this at all.  It would be (at the time of this post) almost just as much effort to simply copy & paste the work over to the new environment.  Be careful of the known shortcomings and plan accordingly.  Because of these issues, depending on the size of your deployment, you need to be aware of the additional time it will take to deploy.

Mastering Wave Data Security for Communities with Security Predicate

**UPDATE** You can now, as of Summer ’17, use Salesforce Sharing Inheritance to accomplish this.  If you’re using External Data Sources or need different security, this works great.  https://help.salesforce.com/articleView?id=bi_security_datasets_sharing_getting_started.htm&language=en_US&type=0

I’ve worked on many projects where one of the main goals of the Community implementation is to display Wave Analytics to their Community Users.  If you’re familiar with security inside of Wave, you might have seen some of the common examples available in the documentation.  Unfortunately, these don’t work well when you’re wanting to implement it for a Community.  In addition, the way you implement a Security Predicate has changed since first releasing, and the documentation sometimes varies for how you would go about doing this.  This post is going to walk you through how you can setup a Security Predicate and master your Communities Wave deployment!

wave.jpg

Business Case

We’re implementing a Customer Community that wants to see Case metrics.  You want the Dataset to be dynamic based on the Running User, and allow them to only see their Account’s data.  This would allow us to use the same Dataset and Dashboard for all of our customers.  

That means being able to control the access of the data at the record (row) level.  Just as you currently do with Sharing Rules in your Org as an Admin today.  This would look like:

Admin View

Admin View

Community User View

RowLevelSecurity

If you’re new to Wave Analytics, you might be confused why Wave doesn’t do this natively.  The reason is because Wave Analytics is connected via an Integration User.  That Integration User is typically going to be an Admin Level Read-Only User.  When we access Wave, we’re accessing the dataset from the credentials of our Integration User.  That means, to enforce Row-Level Security, we have to put our Security Predicate inside every Dataset we need to secure.

Alright, let’s get into the how this is done.

To start off, we need to know what our Root is.  In this case, pun intended, we’re going to be using the Case Object as our Root.  The Root is what record you want returned.  Since we’ve already got the Account ID field native to the Case Object, all we need to do is add a custom Text Formula Field called View All Data, and make the value “View All Data”

ViewAllData.png

On the User Object, we need to have a Formula Field that returns the same value when it is an Internal User.  To keep it simple, I’m just granting all Internal Users View All Data privileges.  If you wanted to make this more complicated, you can easily expand on this.

ViewAllDataOnUser.png

Looking into our Dataset’s JSON, you can see we’ve got the AccountId and ViewAllData__c pulled in.  If you don’t bring in the fields you want to reference in your Security Predicate, it won’t work.

Fields in Dataset

Based on everything above, what we’re looking to have as our Security Predicate is:

‘AccountId’ == “$User.AccountId” || ‘ViewAllData__c’ == “$User.ViewAllData__c”

‘AccountId’ == “$User.AccountId” is how we are adding in the Community User’s dynamic filter.  All Cases where the AccountId matches the Community User’s AccountId will be shown.  Keep in mind, you could get creative and use formula fields here if you wanted it to work for an Account Hierarchy instead of just one Account.

|| yes, we can use operators like OR in this, which gives you control to get creative with your sharing.

‘ViewAllData__c’ == “$User.ViewAllData__c” this is how we grant access to all Internal Users.  Because, all of the Internal Users will have “View All Data” populated on their User, and all Cases have “View All Data” filled out as well.

Previously, we’d have to download this JSON, and modify the sfdcRegister (103) and include our row-level security predicate there.  Now, we just need to navigate to our Dataset in Wave.  Note – if you attempt to add your security predicate in it the old way, it won’t work and you’ll be left scratching your head.

Once you’re to your Dataset, select Edit.

Cases Dataset.png

Insert the Security Predicate

Security Predicate.png

Select Update Dataset.  The next time your Dataflow runs it will update with your Security Predicate.  Just like that… you’re all set!  You’ve mastered row-level security in Wave.

How to add Quick Actions and a Link in Wave Analytics

If you’re using a Table inside your Dashboard or Lens, as you start to drill down into the data you probably want to either navigate to the record or perform an action. Currently, that is not something Wave is setup to do out-of-the-box.  While this is not a very hard thing to setup, it could be somewhat confusing for any Administrator that is trying to learn Wave.  By the end of this you’ll post you’ll hopefully have no issues adding the Open Record and Actions to your Dataset, and understand some of the quirks associated with the feature.

The first thing to note, is this is Dataset specific.  This change has to take place on every Dataset that you want the ability to drill into.

Before we get started, let’s see what we’re going to accomplish in this blog post:

Default

without

Quick Actions & Record Open Enabled

withactions

Navigate to your Dataset

We want to navigate to our Dataset by selecting Edit under the Dataset.

edit-dataset

Download the XMD JSON

You’ll see a blue download icon, hit that to download the file.

OpportunityDataset.png

Open & Reformat the JSON

When I open the XMD file in Sublime, you’ll notice it isn’t formatted in a readable way.  I would recommend getting a plugin that will reformat this for you.  If that isn’t an option for you, no big deal, I’ve found this site to be great at formatting and helping you troubleshoot errors.  After it is formatted, it should look something like this (if you’re working with a clean Dataset):

formattedjson

Understanding the Parameters

Great, so we’ve got the code formatted to work with now.  Let’s talk about what paremters we have available to work with:

  1. recordIdField
    • This is the field that enables your Actions and the Link to the record.
  2. Field
    • The name of the dimension that the menu appears on in dashboard and lens charts and tables.
      • Let me make sure it is clear — you can not add this to a Measure
    • This ideally is a unique value to enhance the end user experience.  If it is not, make sure you use the recordDisplayFields parameter to improve the user experience.
  3. recordDisplayFields
    • If you put your action and record open on a field that isn’t unique in your table, Salesforce will ask you to select the record that you want to work with.
  4. linkTemplate
    • The default for this is to the Record Id field (the row’s Id).  However, you can use this parameter to setup a custom URL that you send the User to.
  5. linkTooltip
    • This is used if you want the Record Open to have a hover message.
  6. sfdcActions
    • By default the Actions will be displayed as your Page Layout’s Actions.  If you want to modify the values in Wave, then you’ll want to customize this to create your own custom list.
  7. linkTemplateEnabled
    • Default is TRUE.  Set this to FALSE if you want to turn the Link off and only have the Actions.
  8. salesforceActionsEnabled
    • Default is TRUE.  Set this to FALSE if you want to turn the Actions off and only have the Link.

What it looks like together

finished-xmd

Update the XMD JSON

Now you just need to upload the updated JSON file into the Dataset, and then hit Update Dataset

UpdateXMDJson.png

Select Update Dataset

updatexmdjson2

All that is left for you to do now is run your Dataflow again so that our updates are put in place.  After your Dataflow finishes running, go in and validate that you now have the Record Link and Quick Actions working!  It looks like this:

withactions

I would recommend looking at this article if you want to do a deep dive into this.

How to create a Top 10 List in Wave Analytics

Often times you’ll find yourself wanting to have a Top 10 list chart.  In Sales, it typically is around your largest clients or the biggest deals in your pipeline.  In Customer Service, it is typically around what customers are opening the most cases.  This is something that is really easy to do within Salesforce’s native Dashboards chart, but not as straight forward as you’d expect in Wave (for the time being, they’ve quietly been making some really great improvements).  We’re going to walk through the steps to show you how easy it can be to do this, if you just know where and how to apply the filter.

Create a new Lens

You do this by clicking on the dataset you want to use for your Lens.  You can also create a Lens (technically a Step) inside your Dashboard.  For this scenario I prefer to just do it this way instead.

cases-dataset-to-create-lens

Group your Lens by Account Name

This grouping can really be whatever you’re trying to do a Top 10 by.  Also, you can add in a secondary group if you want to have a stacked chart.  For this post, we’ll keep it simple and just use one group.

Select Account Name.jpg

Sort your Lens by Descending order

Dsc Lens.jpg

Go to your Lens’ JSON editor

To access this, you’ll use one of this keyboard shortcut: CRTL+E (Windows) or CMD+E (Mac).  If you need more information on the keyboard shortcuts available, check out this.

JSON view in lens.jpg

Add in the your record Limit

This is going to take place inside the “query”.  It is a really simple line that you just add in.  It doesn’t matter if you place it above “groups” or below “measures”, it just goes anywhere inside of the “query”.

“limit”:10,

Add in the Limit.jpg

Clip your Lens to the Designer

When you clip your Lens to the Designer, you’re now able to grab it inside your Dashboard.

Clip to Designer.jpg

Add the Step/Lens to your Dashboard

Drag out the Step/Lens to your Dashboard and you’re all set.  This will change as you slice and dice your data and show you a dynamic Top 10 list.  If you want to keep your list static and not faceting with the changes in your dataset, you’ll want to turn that off in your Step’s settings.

Drag Lens out to Dashboard.jpg

With that, you’re all set.  As you hopefully can see, it really isn’t very hard to do, but it can be confusing at first to know where to put in your filter.

Note: You are able to edit the JSON of your Lens/Step in your Dashboard.  I chose to do it separately in a Lens to simplify the editing of the JSON.


Tailoring your Wave Dashboards with the Layout Manager

One of the things that Wave has recently transitioned from having the Flex Designer as BETA and making it now the Standard Wave Dashboard Designer.  Now that it is out of BETA we have tons of new features available that really allow you to create some fantastic layouts tailored to different devices and screen resolutions.  The beauty of the Flex Designer (now called Wave Dashboard Designer), is that it would change the different charts, filters, and other pieces of your Dashboard based on the size of the monitor.  Note: there were previously other ways of doing this, but now Salesforce has made this extremely easy!


When you’re editing your Layout’s properties, you now have the option to control the amount of columns and their spacing.  This gives you more control than before when you’re trying to make a beautiful dashboard.

grid

Columns determines how many columns your Grid will have.  The more you have, the more control you have with your different dashboard elements.  I’ve yet to hear of any downsides for bumping it up to 50 columns (the max).

Cell Spacing is how much space is between the different cells or blocks on your grid.  You have the option of 0, 4, 8, and 12.

4

4

16

16.jpg

The Maximum Dashboard Width plays into our next section on the Layout editor, Device.  This is where we get to control what devices and monitors will work with this Layout.

device

Screen Width allows you to set ranges that this Layout will work for.  In this image, I’m creating this for really large screens only, and I’ve just set a minimum width for the layout.  For my Standard layout I used both the minimum and the maximum width values.  Note: these numbers are in pixels.

Orientation is whether or not you want to make the Layout only work for Landscape or Portrait orientations.  It defaults to all, but having the ability to dynamically change it also based on the device’s orientation is fantastic!

Platform allows you to determine if your Layout works for iOs, Android, or both.

How does it all tie together?

When you’re editing your Dashboard you’ll see your Layout dropdown to the left of the back and forward arrows.  You can see here that I’m able to create my own Layouts for one Dashboard.  This gives you full control now over how the Dashboard will look at multiple aspect ratios.

layout-manager

Let’s take a look at this in action.  Below, I’m presenting you two very different Dashboard Layouts inside the same Cases Dashboard!  The first screen shot is for Large Screen Users, and the screen shot is for iPad Pro Users.  Notice, I can now add a variety of charts and filters based on the specific layout without any heavy lifting!

Large Screen View

largescreen

iPad Pro View

ipad-pro-dashboard-view