Often times you’ll find yourself wanting to have a Top 10 list chart. In Sales, it typically is around your largest clients or the biggest deals in your pipeline. In Customer Service, it is typically around what customers are opening the most cases. This is something that is really easy to do within Salesforce’s native Dashboards chart, but not as straight forward as you’d expect in Wave (for the time being, they’ve quietly been making some really great improvements). We’re going to walk through the steps to show you how easy it can be to do this, if you just know where and how to apply the filter.
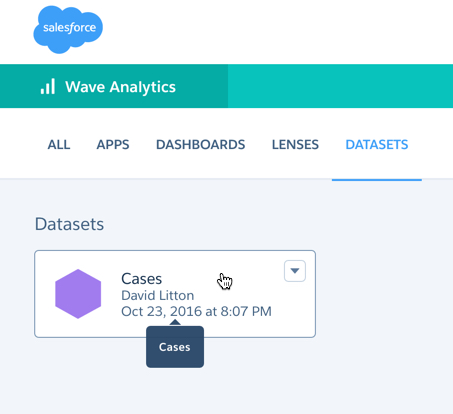
Create a new Lens
You do this by clicking on the dataset you want to use for your Lens. You can also create a Lens (technically a Step) inside your Dashboard. For this scenario I prefer to just do it this way instead.
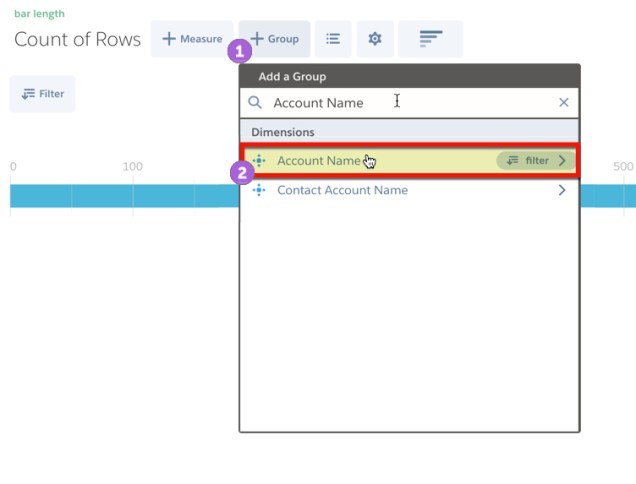
Group your Lens by Account Name
This grouping can really be whatever you’re trying to do a Top 10 by. Also, you can add in a secondary group if you want to have a stacked chart. For this post, we’ll keep it simple and just use one group.
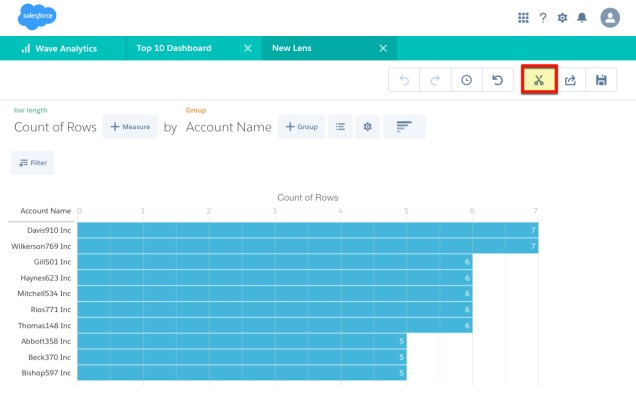
Sort your Lens by Descending order

Go to your Lens’ JSON editor
To access this, you’ll use one of this keyboard shortcut: CRTL+E (Windows) or CMD+E (Mac). If you need more information on the keyboard shortcuts available, check out this.

Add in the your record Limit
This is going to take place inside the “query”. It is a really simple line that you just add in. It doesn’t matter if you place it above “groups” or below “measures”, it just goes anywhere inside of the “query”.
“limit”:10,

Clip your Lens to the Designer
When you clip your Lens to the Designer, you’re now able to grab it inside your Dashboard.
Add the Step/Lens to your Dashboard
Drag out the Step/Lens to your Dashboard and you’re all set. This will change as you slice and dice your data and show you a dynamic Top 10 list. If you want to keep your list static and not faceting with the changes in your dataset, you’ll want to turn that off in your Step’s settings.

With that, you’re all set. As you hopefully can see, it really isn’t very hard to do, but it can be confusing at first to know where to put in your filter.
Note: You are able to edit the JSON of your Lens/Step in your Dashboard. I chose to do it separately in a Lens to simplify the editing of the JSON.
